Line chart. Data table with 6 rows and 2 columns follows.
| 2026/9/1 | 57.7 |
|---|---|
| 2026/9/2 | 57.5 |
| 2026/9/3 | 57.7 |
| 2026/9/4 | 57.4 |
| 2026/9/5 | 57.7 |
| 2026/9/6 | 57.5 |

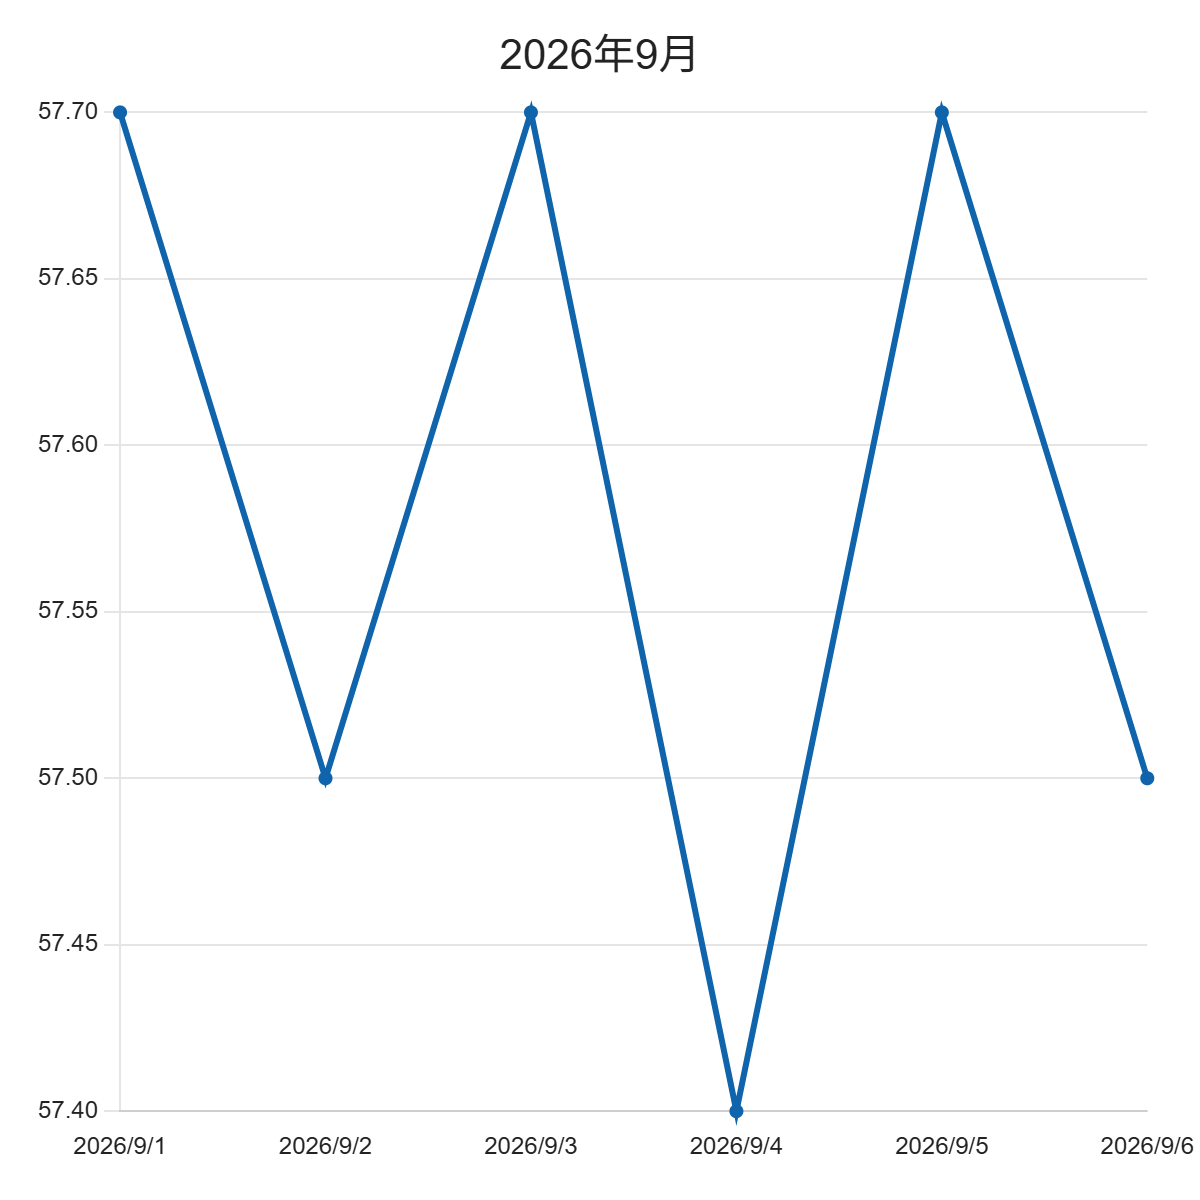
Line chart. Data table with 6 rows and 2 columns follows.
| 2026/9/1 | 57.7 |
|---|---|
| 2026/9/2 | 57.5 |
| 2026/9/3 | 57.7 |
| 2026/9/4 | 57.4 |
| 2026/9/5 | 57.7 |
| 2026/9/6 | 57.5 |
コメント